Leander Floodplain Model & Map Updates – Upper Brushy Creek
Improving our understanding of flood risk based on recent development and updated data
Project Purpose
When we think about the tremendous growth and development coming to Central Texas, a potential increase in flood risk probably isn’t the first thing on our minds. Most of us are more likely to think about rising home prices or rush hour traffic.
But the truth is that as more and more of our natural landscape is replaced by impervious cover (roofs, concrete, and asphalt), less stormwater infiltrates into the ground, which can lead to an increase in peak runoff. At the same time, average rainfall is on the rise in our region, as measured by the National Oceanic and Atmospheric Administration (NOAA), who released new rainfall data for hydrologic and hydraulic analysis (known as Atlas 14) in 2018. Together, these factors make it necessary for local governments to reassess the models and maps that give us a more realistic indication of flood risk.
A little bit of background: The Upper Brushy Creek Water Control and Improvement District completed a Flood Protection Plan in 2016 to identify and prioritize flooding concerns within the Upper Brushy Creek watershed. The City of Leander, which is located within this watershed, recently retained KFA to perform a subsequent City of Leander Model and Mapping Update for Upper Brushy Creek. This study updates the Upper Brushy Creek Watershed hydrologic and hydraulic (H&H) models and floodplain maps within and adjacent to the Leander jurisdictional limits based on available data, which is discussed in more detail in the following section.
Project Approach
As discussed above, there are two main reasons to update Leander’s floodplain models and maps. First, there is a need to incorporate the updated Atlas 14 rainfall data (released by NOAA in 2018), which means the models will show more runoff and more discharge through dam spillways. Second, increasing development means there is more impervious cover throughout the city, leading to cumulative impacts of increasing runoff. It’s important that the city’s maps and models reflect both of these changes so flood risk is not underestimated.
Beginning with the FEMA effective models, KFA made the following specific adjustments to create Leander’s new models and maps:
- Implemented Atlas 14 rainfall predictions for a range of storm events.
- Developed impervious cover distributions for existing and fully developed conditions.
- Evaluated and adjusted stream roughness values.
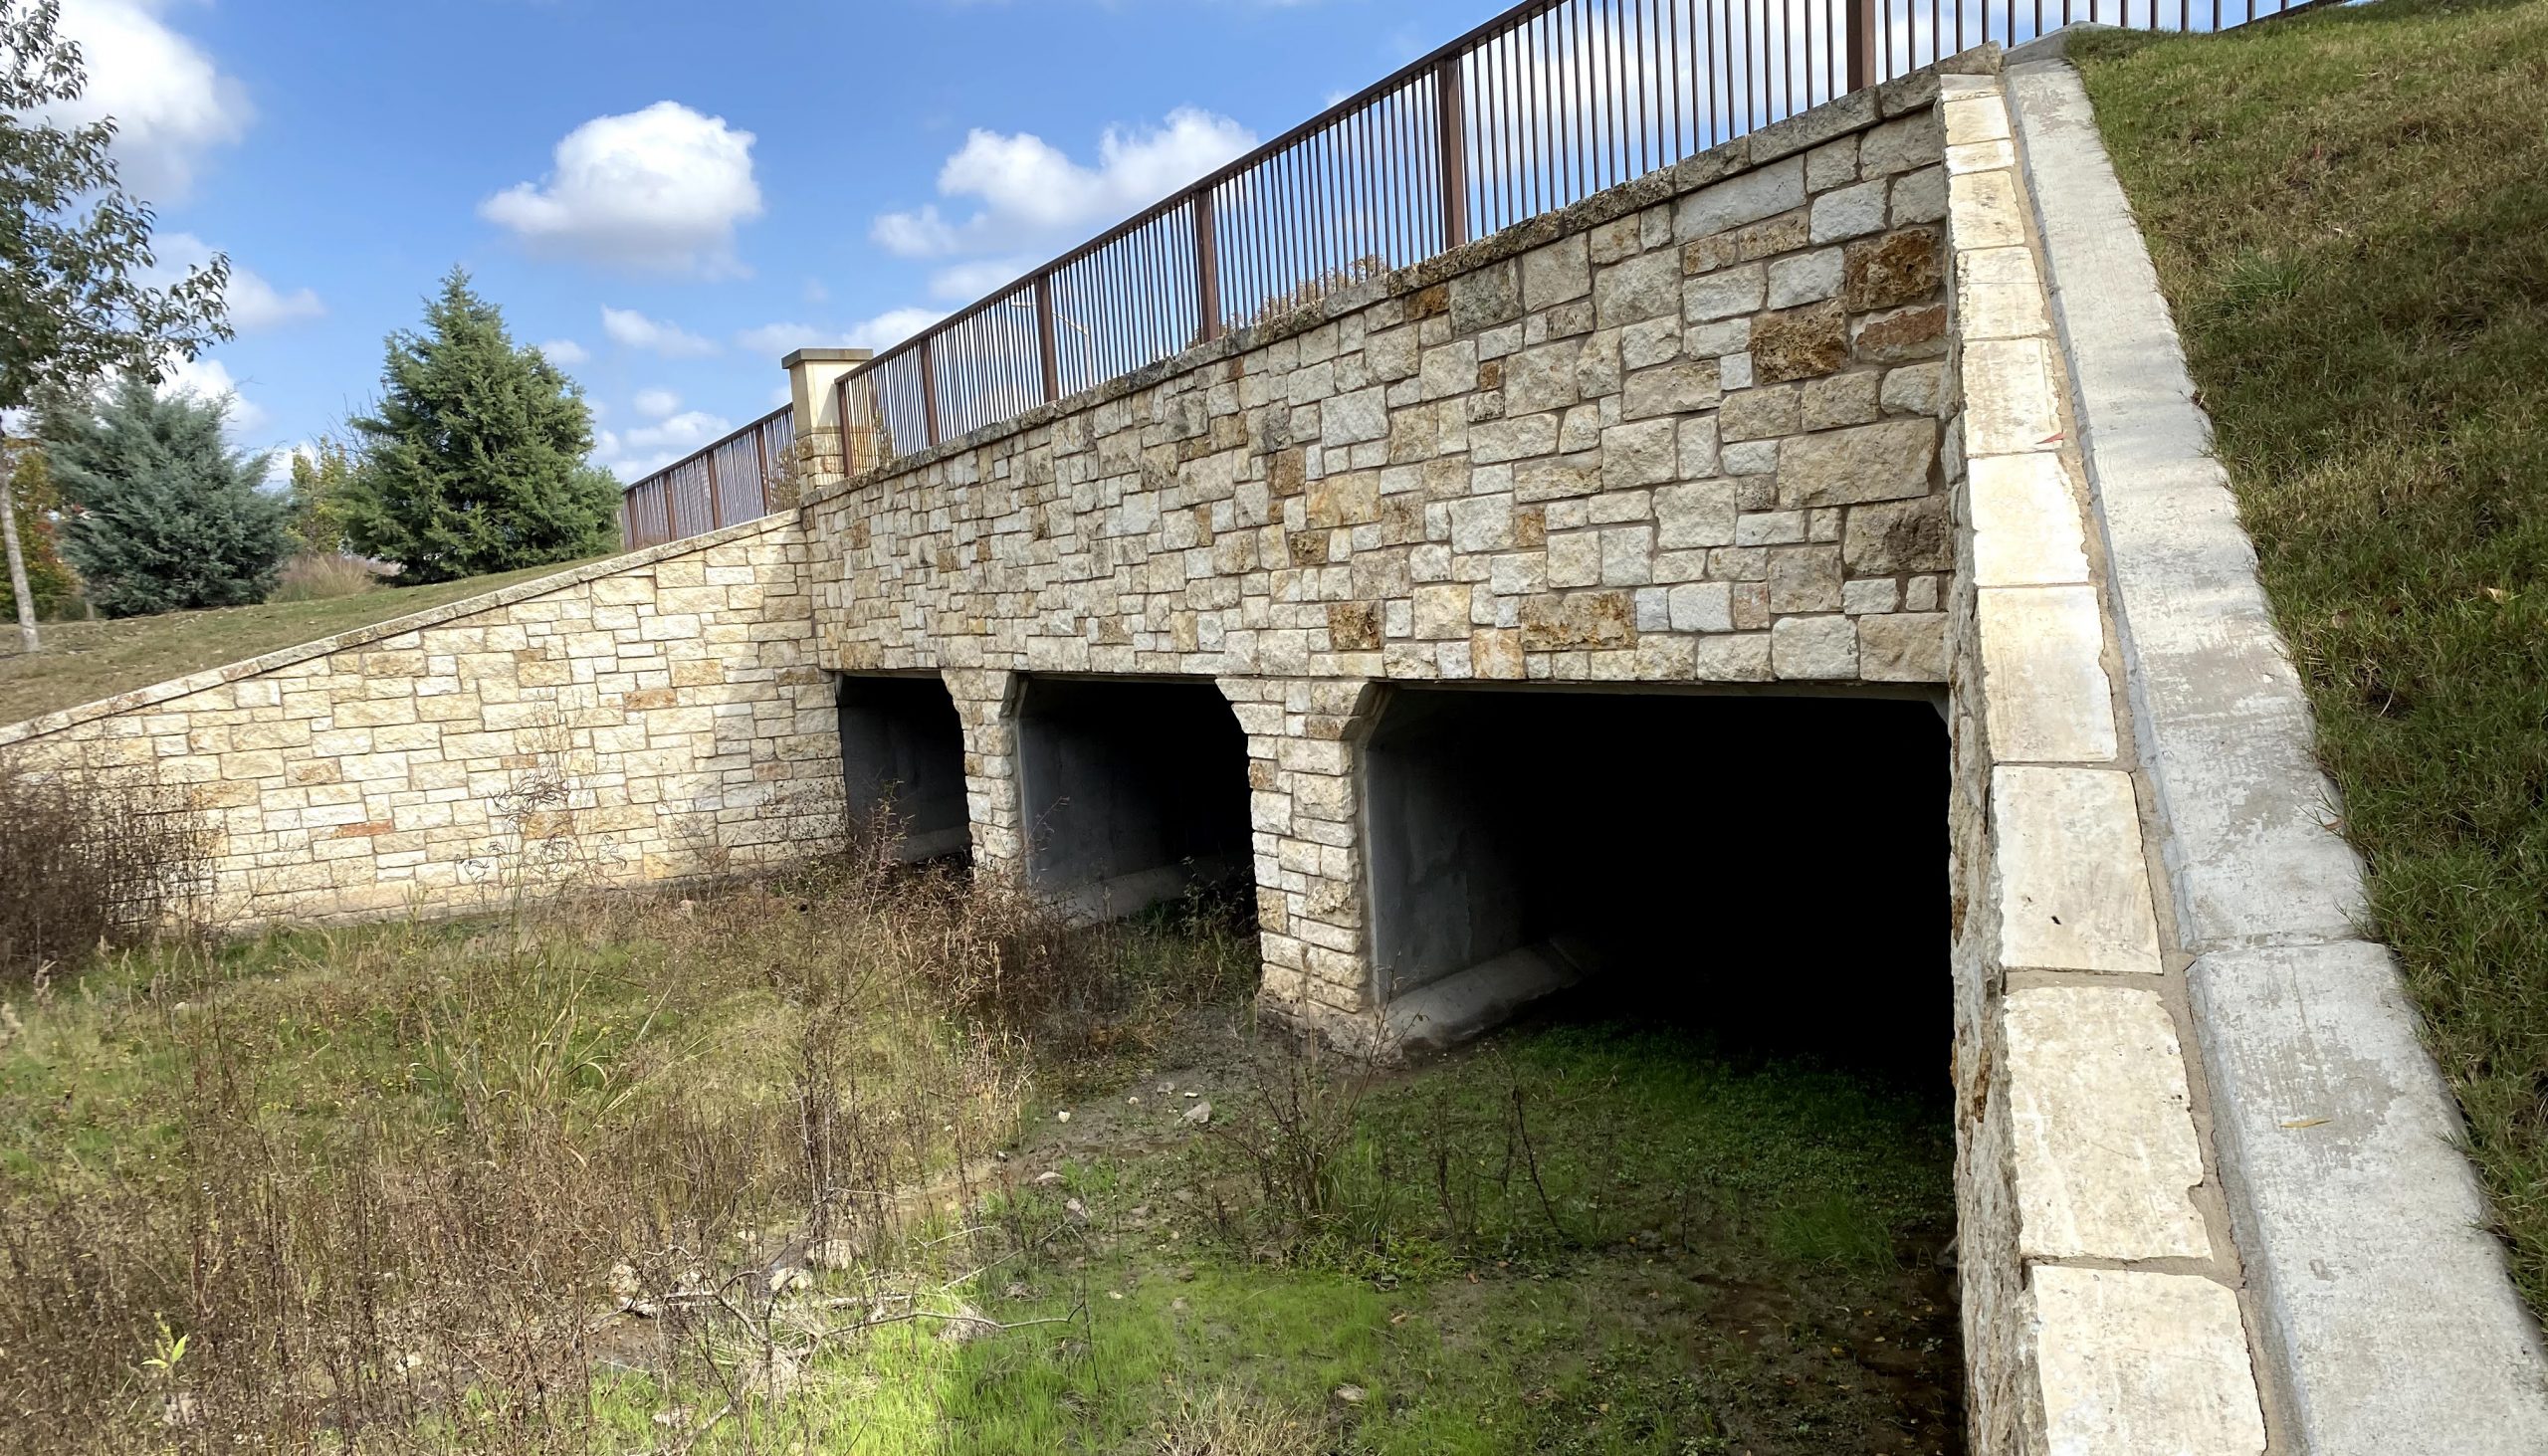
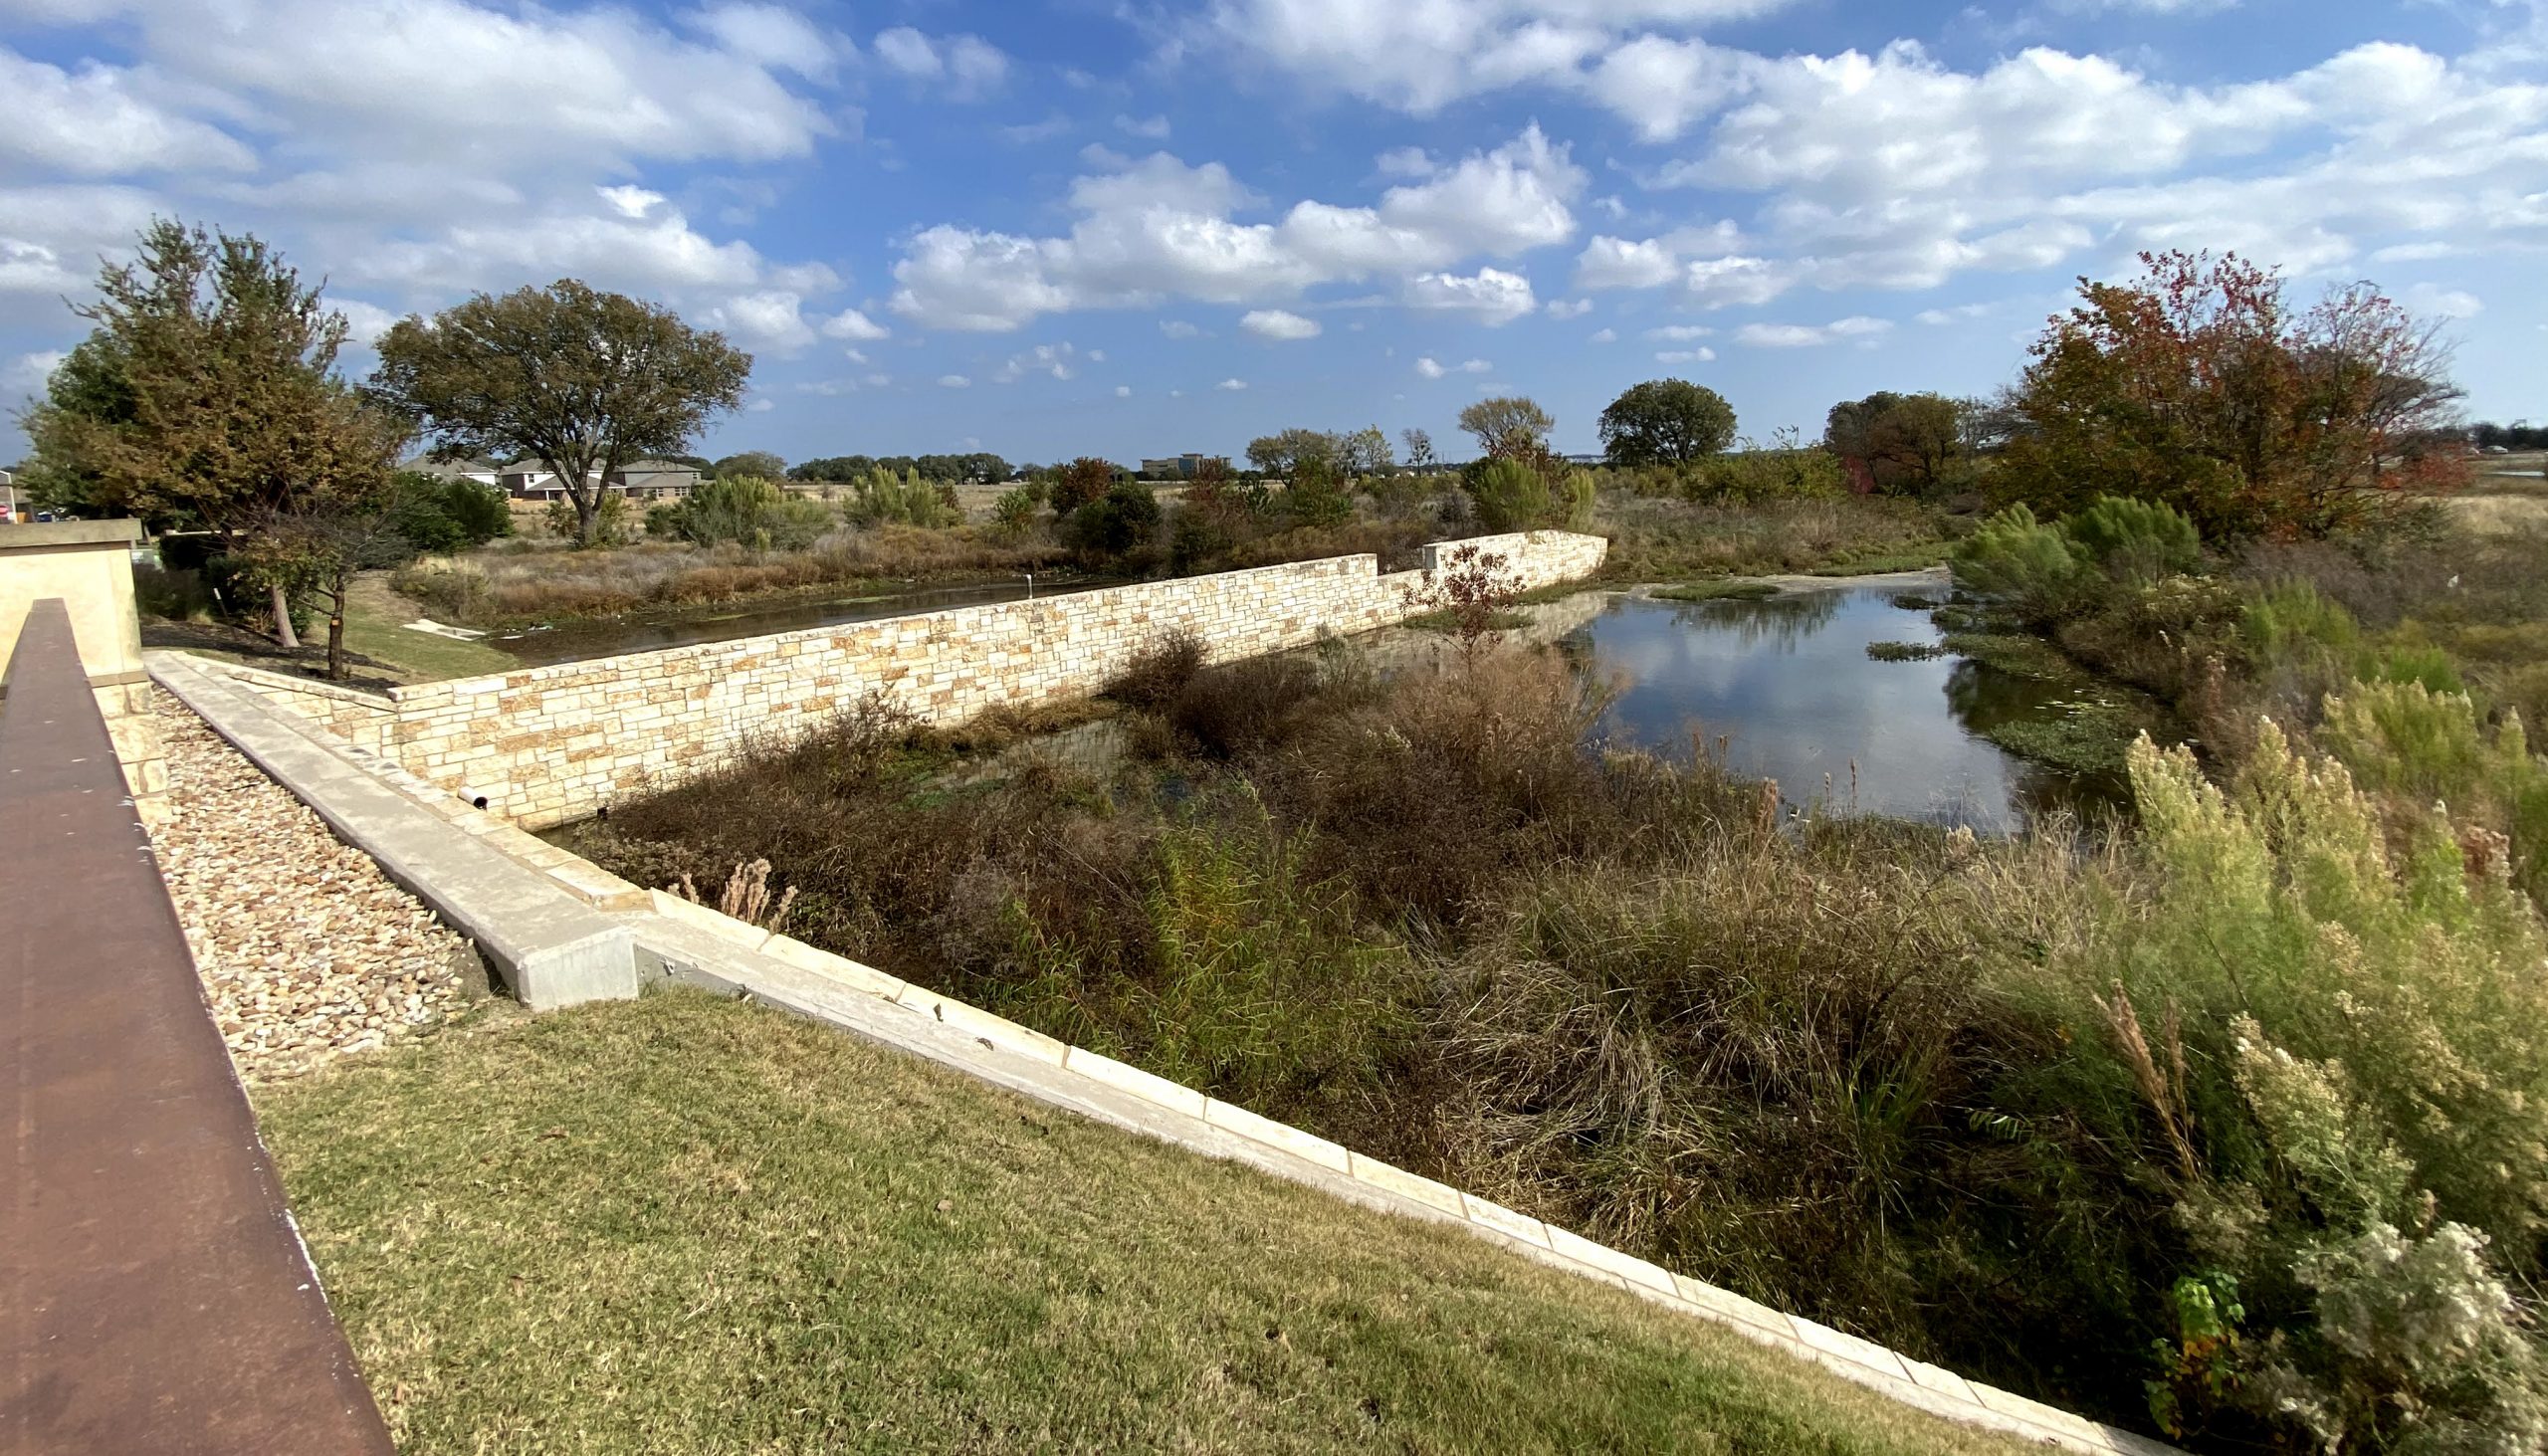
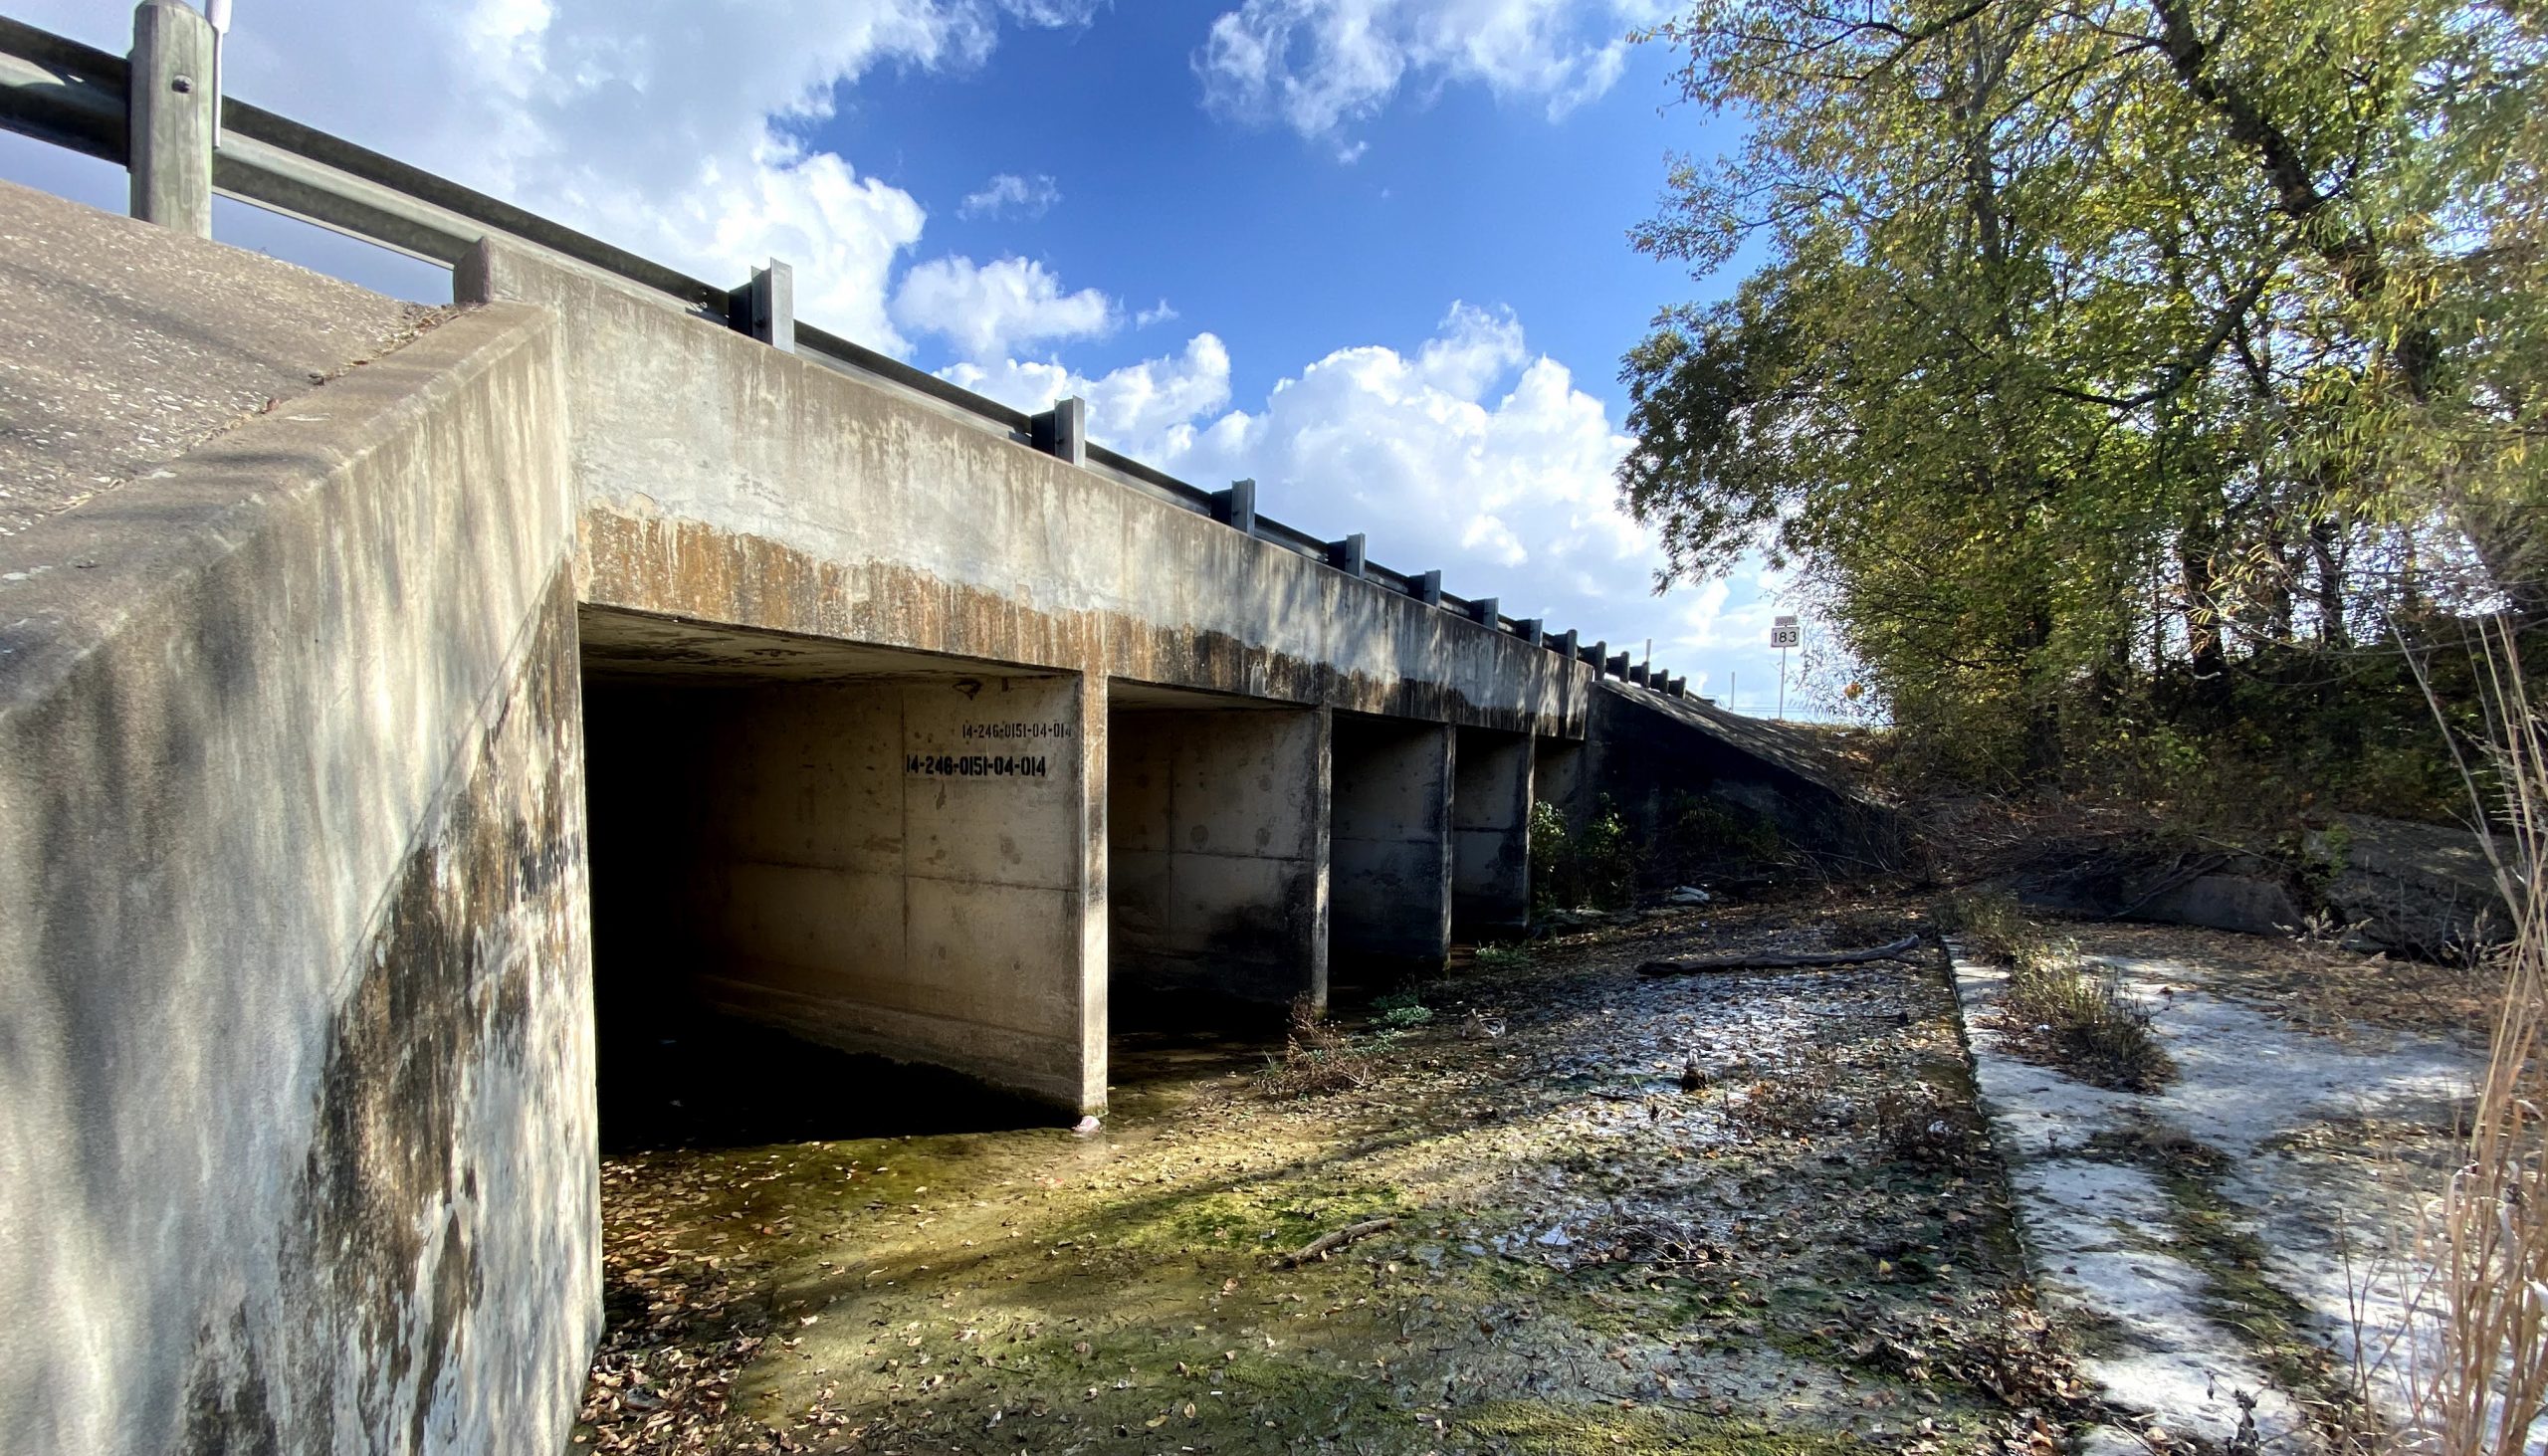
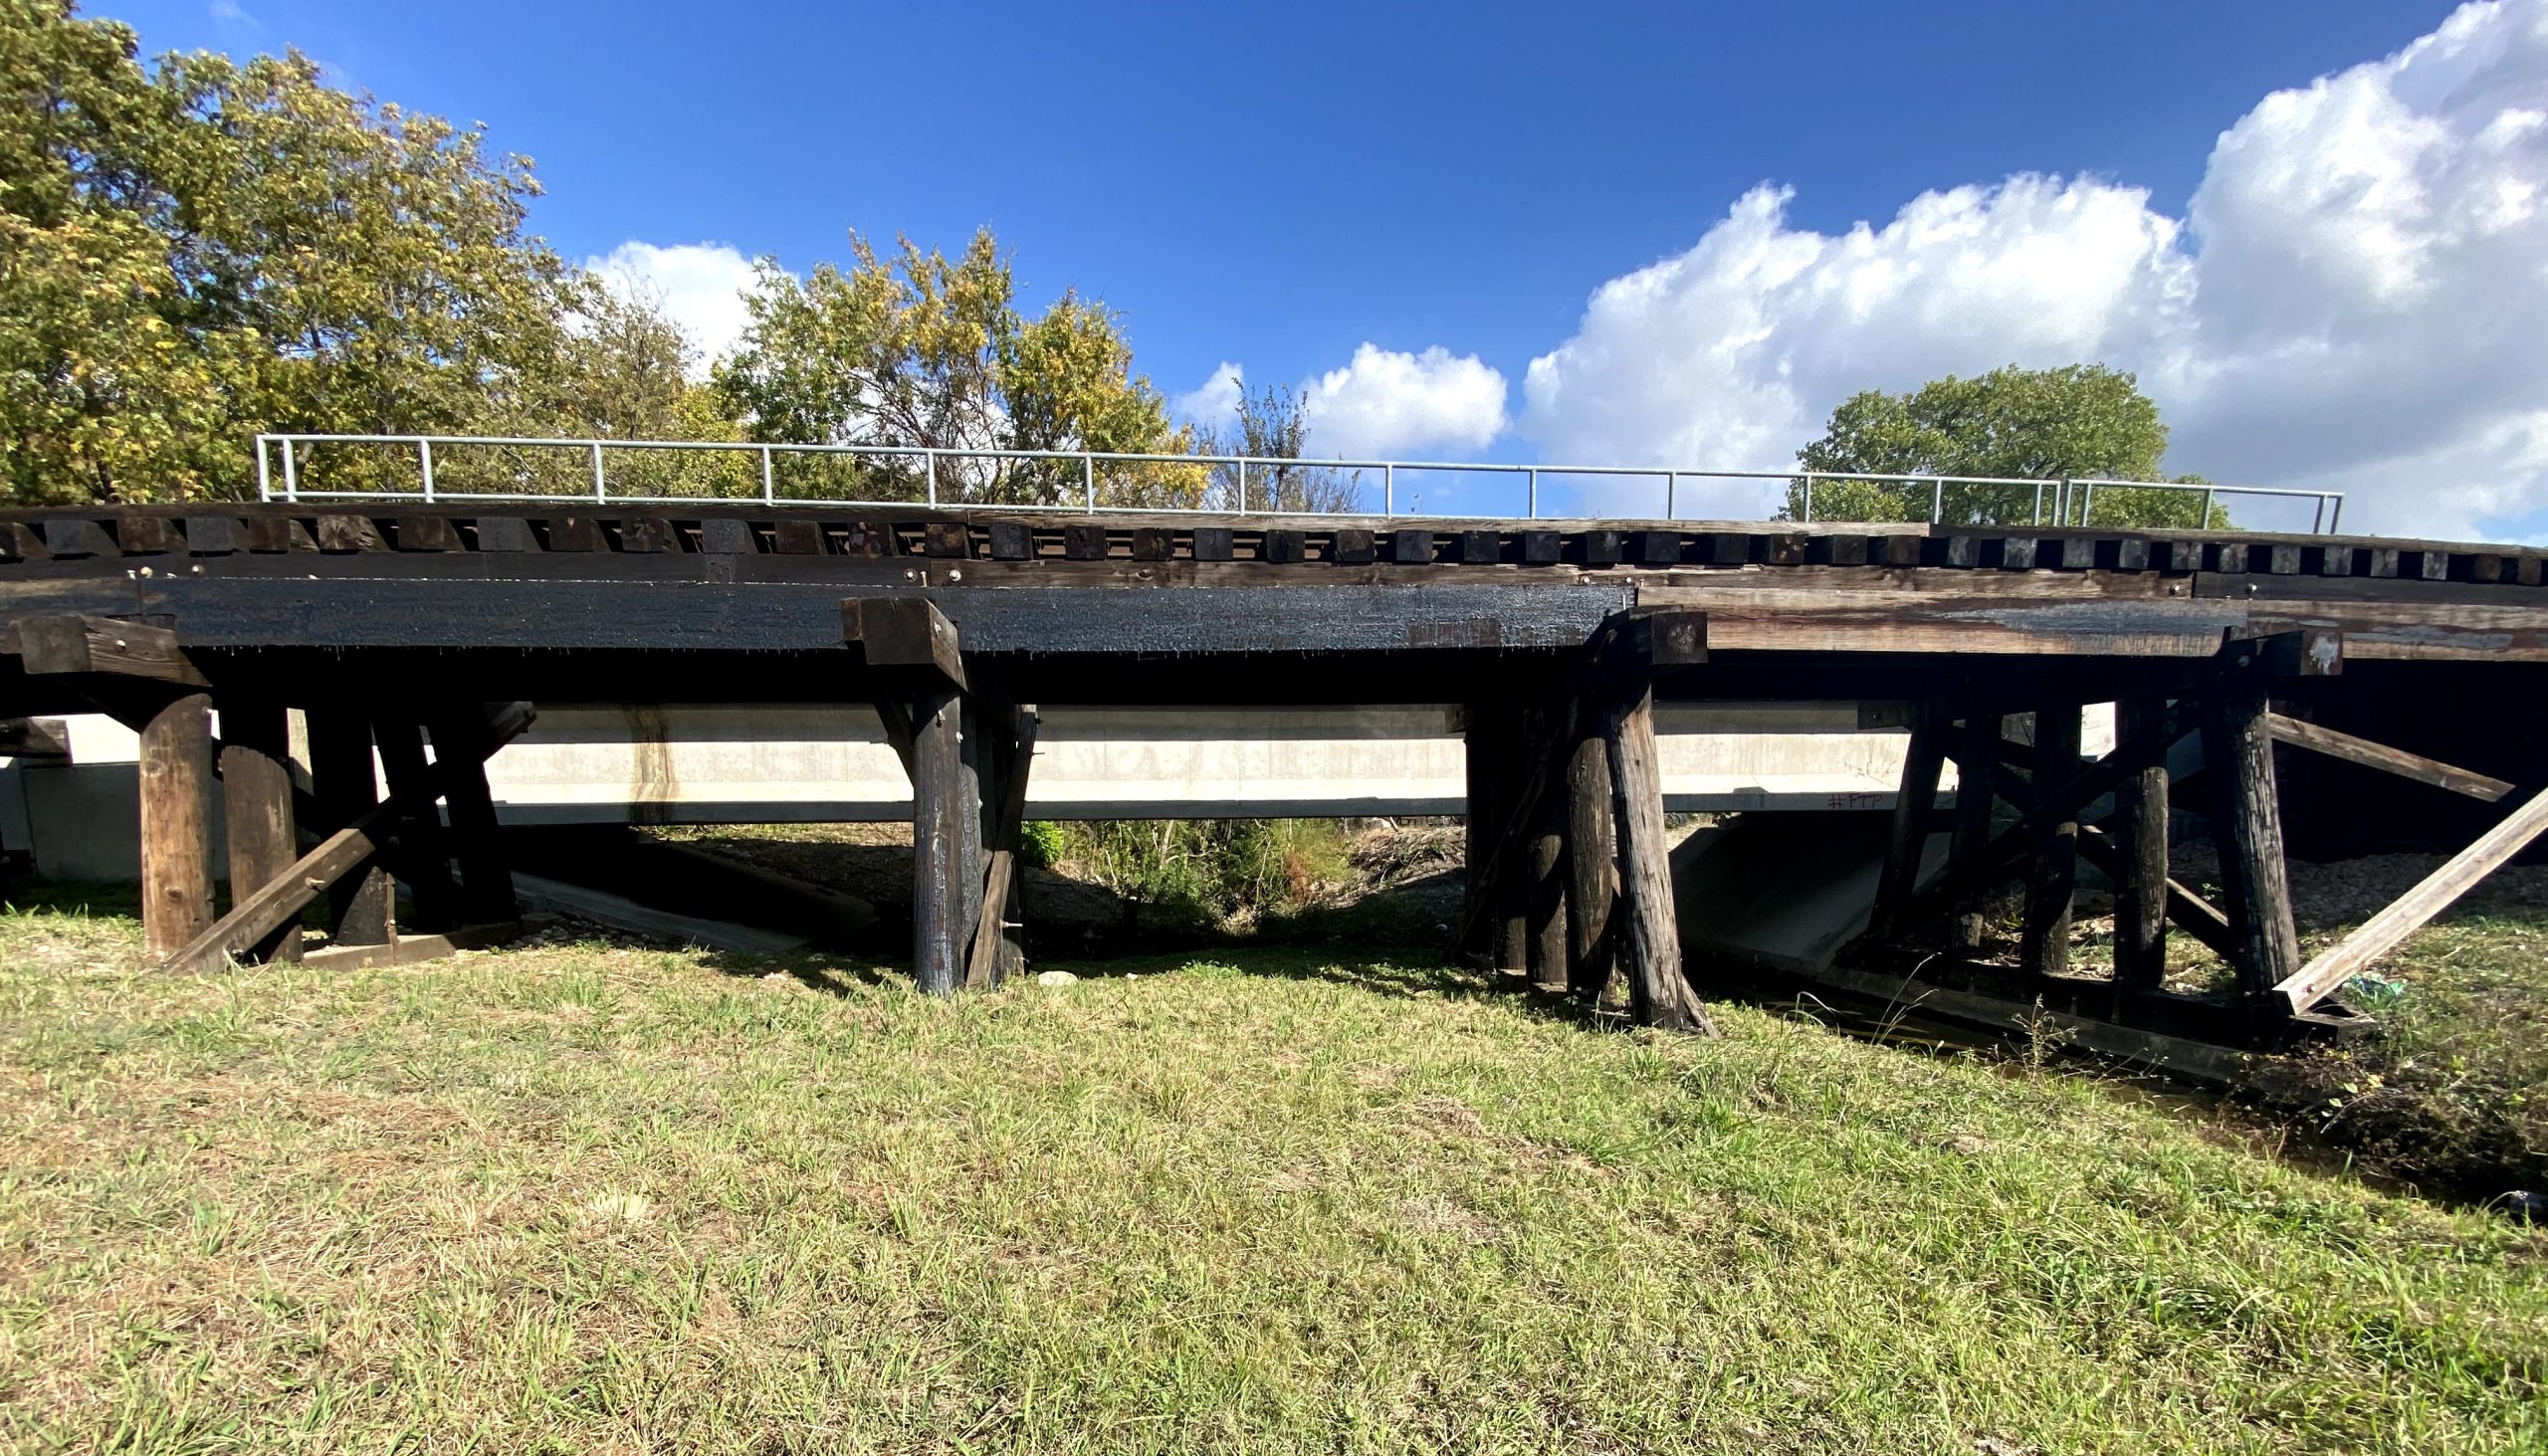
- Added or updated structure geometry for six bridges and culverts based on survey data.
- Incorporated 4 recent Letter of Map Revision (LOMR) submittals.
Completing the updates successfully required coordination with Williamson County, who is in the process of updating the floodplain maps countywide. KFA also found technical solutions to update the models, such as simplifying a complex modeling tool to input flows from the hydrologic HEC-HMS model to the hydraulic HEC-RAS model. Another method we used was extending HEC-RAS cross-sections to accommodate expanded 500-year fully developed conditions floodplain.
Project Results
The results of this modeling effort showed significant increases in flow throughout the watershed. These flow increases, however, do not correspond directly to changes in floodplain width; to update the FEMA effective models, model results must be applied to current topography. The new best available models and maps generated by this study will be retained by the City for local regulatory purposes or ultimately submitted to FEMA for a Physical Map Revision (PMR). Either way, they give the City an increased understanding of flood risk for the current and ultimate development conditions. This means the City will be able to more effectively guide development to reduce risks to personal safety and property as a result of increasing runoff. The maps and models should continue to be updated as development occurs.
A PMR is an action whereby the regulatory flood hazard data, including one or more Flood Insurance Rate Map (FIRM) map panels, associated Flood Insurance Study (FIS), and National Flood Hazard Layer (NFHL) are physically revised and republished. Since a PMR is used to change flood risk zones, floodplain and/or floodway delineations, flood elevations, and/or planimetric features, KFA performed all modeling, mapping, shapefile development, and reporting for this project according to applicable FEMA standards so the data can be submitted for formal map updates in the future.